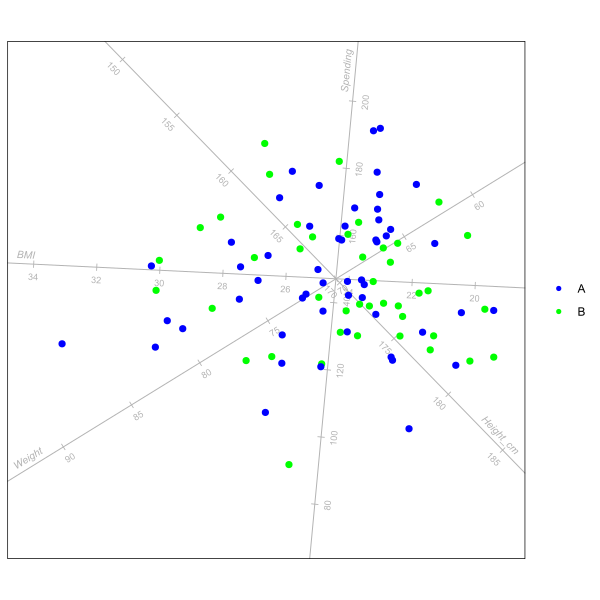
data_check <- function(df, threshold = 0.97, display_issues = TRUE) {
  if (!any(class(df) %in% "data.frame")) {df <- as.data.frame(df)}
  varnames <- names(df)
  num_vars <- seq_len(ncol(df)) |> sapply(\(j) {
    isnum <- is.numeric(df[[j]])
  })
  valid_vars <- seq_len(ncol(df)) |> sapply(\(j) {
    if (num_vars[j]) {
      sd(df[[j]]) > 0
    } else {
      FALSE
    }
  })
  degenerate <- num_vars & !valid_vars
  if (any(degenerate)) {
    degen_df <<- data.frame(Name = varnames[degenerate],
                            Number = which(degenerate),
                            Problem = "Degenerate"
                           )
    if (display_issues) {
      cat("\n\nThe following variables have no variation to model:\n\n")
      degen_df |> knitr::kable() |> print()
      cat("\n\n")
    }
  }
  numv <- which(valid_vars)
  num_df <- df[,valid_vars]
  p <- ncol(num_df)
  abscormat <- abs(cor(num_df) - diag(p))
  colinear_df <<- seq(1, p - 1) |> lapply(\(i) {
    seq(i + 1, p) |> lapply(\(j) {
      if (abscormat[i,j] > threshold) {
        m <- lm(df[[numv[j]]] ~ df[[numv[i]]]) |> coef()
        data.frame(Num1 = numv[i], Num2 = numv[j],
                   Var1 = varnames[numv[i]],
                   Var2 = varnames[numv[j]],
                   Corr = abscormat[i,j],
                   Formula = paste0(
          varnames[numv[j]], " ≈ ", round(m[2], 3), "*", varnames[numv[i]],
          " + ", round(m[1], 3)))
      }
    }) |> do.call(rbind, args = _)
  }) |> do.call(rbind, args = _)
  if (display_issues && !is.null(colinear_df)) {
    cat("\n\nThe following variables have severe colinearity:\n\n")
    colinear_df[,3:6] |> knitr::kable() |> print()
    cat("\n\n")
  }
  all_fine <- !degenerate
  if (!is.null(colinear_df)) {all_fine[colinear_df$Num1] <- FALSE}
  df[, all_fine]
}

missing_check <- function(df, threshold = 0.5, display_issues = TRUE) {
  empty_vars <- seq_len(ncol(df)) |> sapply(\(j) {
    mean(is.na(df[[j]])) > threshold
  })
  if (display_issues & any(empty_vars)) {
    cat("\n\nVariables dropped for containing too few non-missing values:\n\n",
        paste(names(df)[empty_vars], collapse = ", "), ".", sep = "")
  }
  df <- df[, !empty_vars]
  num_vars <- seq_len(ncol(df)) |> sapply(\(j) {
    isnum <- is.numeric(df[[j]])
  })
  problem_rows <- seq_len(nrow(df)) |> sapply(\(r) {
    any(is.na(df[r, num_vars]))
  })
  if (display_issues & any(problem_rows)) {
    cat("\n\nRows dropped for containing missing values:\n\n",
        paste(which(problem_rows), collapse = ", "), ".", sep = "")
  }
  df[!problem_rows, ]
}

good_angles <- function(bp, threshold = 0.07, display_issues = TRUE) {
  angles <- atan2(bp$ax.one.unit[,2], bp$ax.one.unit[,1]) %% pi
  dist_df <- rbind(data.frame(Varnum = 1, Fine = TRUE, Closest = 1),
    seq(2, length(angles)) |> lapply(\(i) {
    difs <- abs(angles[seq_len(i-1)] - angles[i])
    data.frame(
      Varnum = i,
      Fine = all(difs > threshold),
      Closest = which.min(difs)
    )
  }) |> do.call(rbind, args = _))
  bp$axes_angles <- dist_df
  if (!all(dist_df$Fine)) {
    issues_df <- dist_df |> subset(!Fine)
    issues_df$Closest_varname <- bp$axes$names[issues_df$Closest]
    varnames <- colnames(bp$X)
    issues_df$Formula <- seq_len(nrow(issues_df)) |> sapply(\(j) {
      m <- lm(bp$X[,issues_df$Varnum[j]] ~ bp$X[,issues_df$Closest[j]]) |>
        coef()
      paste0(varnames[issues_df$Varnum[j]], " ≈ ", round(m[2], 3),
             "*", varnames[issues_df$Closest[j]],
            " + ", round(m[1], 3))
    })
    if (display_issues) {
      issues_df |> kable() |> print()
    }
    bp$angle_issues_df <- issues_df
  }
  bp$good_angles <- dist_df$Fine |> which()
  bp
}

robust_biplot <- function(df, group_col = 1, compile_issues = TRUE) {
  clean_df <- df |> missing_check(display_issues = FALSE) |>
    data_check(display_issues = FALSE)
  bp_obj <- clean_df |> biplot(classes = clean_df[[group_col]],
                               scaled = TRUE) |> PCA() |>
    good_angles(display_issues = FALSE)
  prop_explained <- bp_obj$eigenvalues[1:2]/sum(bp_obj$eigenvalues)
  p_expl <- round(prop_explained*100)
  plt <- bp_obj |>
    axes(which = bp_obj$good_angles) |>
    plot()
  if (compile_issues) {
    tryCatch({
      cat("\n\n")
      degen_df |> kable() |> print()
    }, error = \(e) NULL)
    tryCatch({
      cat("\n\n")
      colinear_df |> kable() |> print()
    }, error = \(e) NULL)
    tryCatch({
      cat("\n\n")
      bp_obj$angle_issues_df |> kable() |> print()
    }, error = \(e) NULL)
  }
  # library(ggplot2)
  # plt + labs(x = paste0("PCA (", p_expl[1], "%)"),
  #                    y = paste0("PCA (", p_expl[2], "%)"))
  bp_obj |> invisible()
}